COVID-19 NH data for week ending January 3, 2021 is now available and carries a date of January 14, 2021. This message is found at the top of the dataset: This Socrata-powered site may be unavailable for routine maintenance from Saturday, January 16, 2021 7:00 PM CST to Saturday, January 16, 2021 8:00 PM CST so be aware of this time period if you want to view the data this weekend.

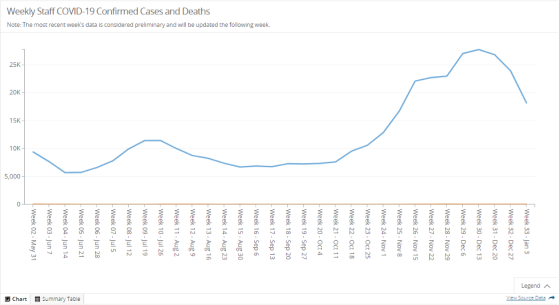
You’ll find this when you open the Summary Table (I used the Next option to show the last several weeks of data for staff cases and death):
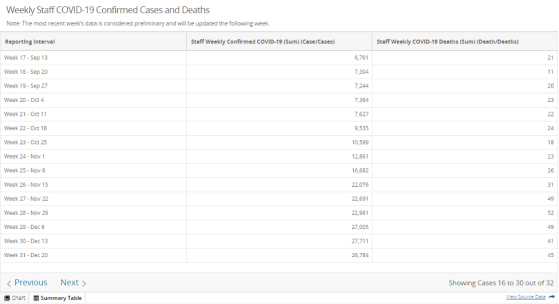

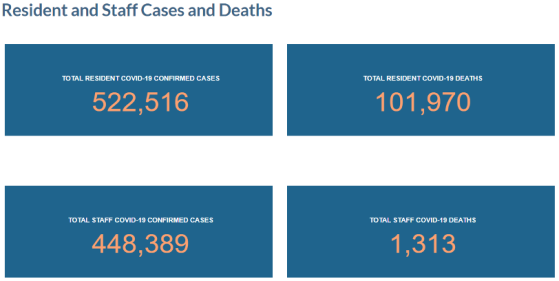
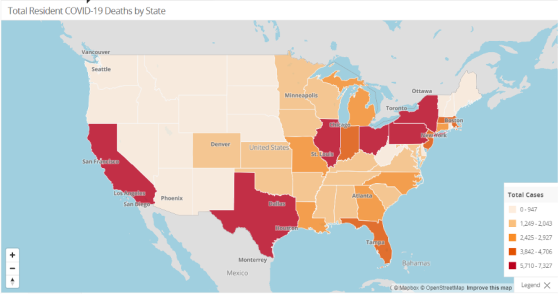
These graphs are found on the COVID-19 Nursing Home Data homepage. I excerpt them for inclusion in my weekly blog on the release of the latest data. A picture speaks a thousand words.


